
5 Charts About the Super Concentrated Stock Market
We may be entering a new bull market, but nearly all of 2023′s returns are from the largest stocks, including Apple, Microsoft, and Nvidia.

It may seem like the stock market is having a good year. But take a closer look, and you see that its gains are more highly concentrated than ever before. Just a handful of stocks are responsible for virtually all the market’s gains so far in 2023, as the bear market looks to become a bull.
Highly concentrated markets aren’t unheard of. In 2020, the 10 largest stocks were responsible for more than a third of the U.S. market’s gains. This year, however, the impact of the 10 largest stocks is more than twice that, breaking recent records by a long shot.
For 2023 through May 31, the Morningstar US Large-Mid Index—a collection of the 716 largest U.S. stocks, one that performs closely in line with the S&P 500—gained 9.6%. While that looks like a solid return, 9.3% (or 97% of the total gain) came from the 10 largest stocks. Without the supersized returns on the largest stocks, the overall market would be flat.
2023 Stock Market Return Breakdown

In fact, the five largest stocks—Apple AAPL, Microsoft MSFT, Alphabet GOOGL, Amazon.com AMZN, and Nvidia NVDA—accounted for a 7.5% gain in the market (78% of the total gain).
Those numbers are eye-popping compared with the market’s average long-term concentration. Since 2009, in years when stocks have risen, the five or 10 largest stocks generally contributed about 5% to 10% of the market’s total gains.
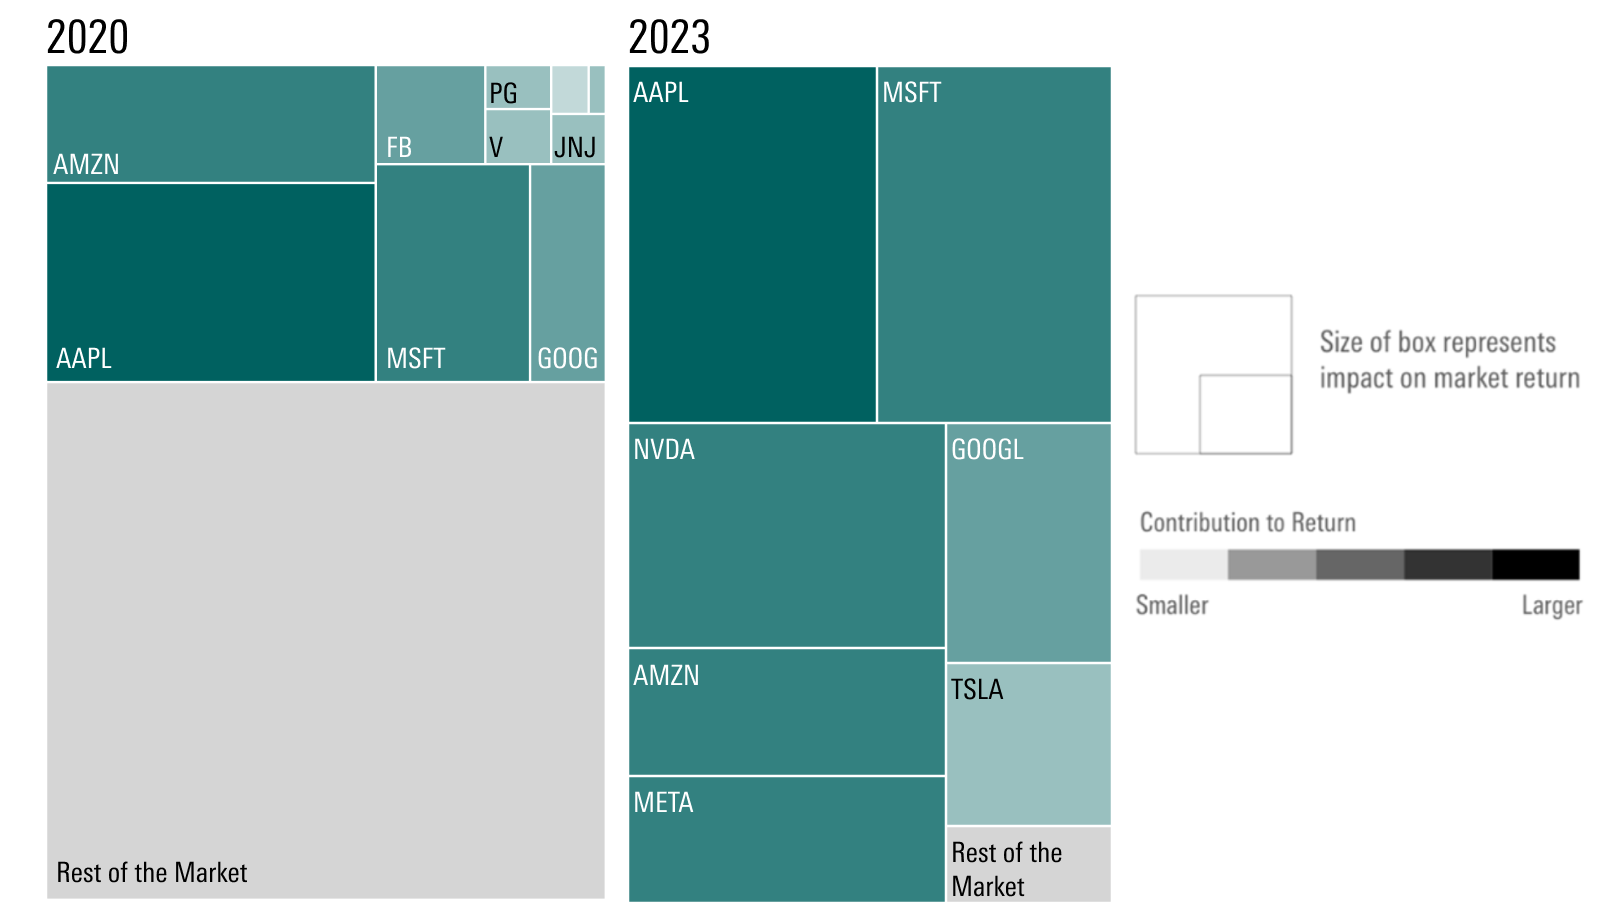
This trend of hyper-concentrated returns isn’t entirely new, but this year it’s reached an unprecedented peak. The most recent previous high-water mark for a concentration of stock market returns came in 2020 when the five largest stocks at the time—Apple, Microsoft, Amazon, Meta Platforms META, and Tesla TSLA—contributed 37% of the returns. In 2023 so far, the concentration of returns coming from the five largest stocks has been double that figure.
Market Impact of the Largest U.S. Companies

It’s a similar story when looking at the 2023 market compared with longer-term trends. We crunched the numbers on the concentration of returns from the five largest stocks in up markets since 2009. We excluded years when the market only had a small overall move (such as 2015′s 0.92% growth), years when the market ended flat (as it did in 2011), and 2022, which was an extreme down market.
On average during those up years, the top five stocks contributed just 3% of returns. Even for the 10 largest stocks, the long-term concentration of returns has averaged just 5%.
Percent of Market Return From Largest Stocks
Though no year in history has been as concentrated as 2023 has been so far, clusters of outperformance or underperformance in the markets are natural. When one of those clusters involves the largest stocks, that can have a significant impact on investor portfolios because the largest companies make up the largest weights of the benchmarks that are most widely tracked by index funds.
For investors in index funds that track the overall market, the effect is the same. An S&P 500 fund or another broad-stock market fund will still have earned them roughly double-digit returns. But as investors learned at the tail end of 2021, big returns on a small group of stocks can also turn into big losses should that handful of companies run into trouble.
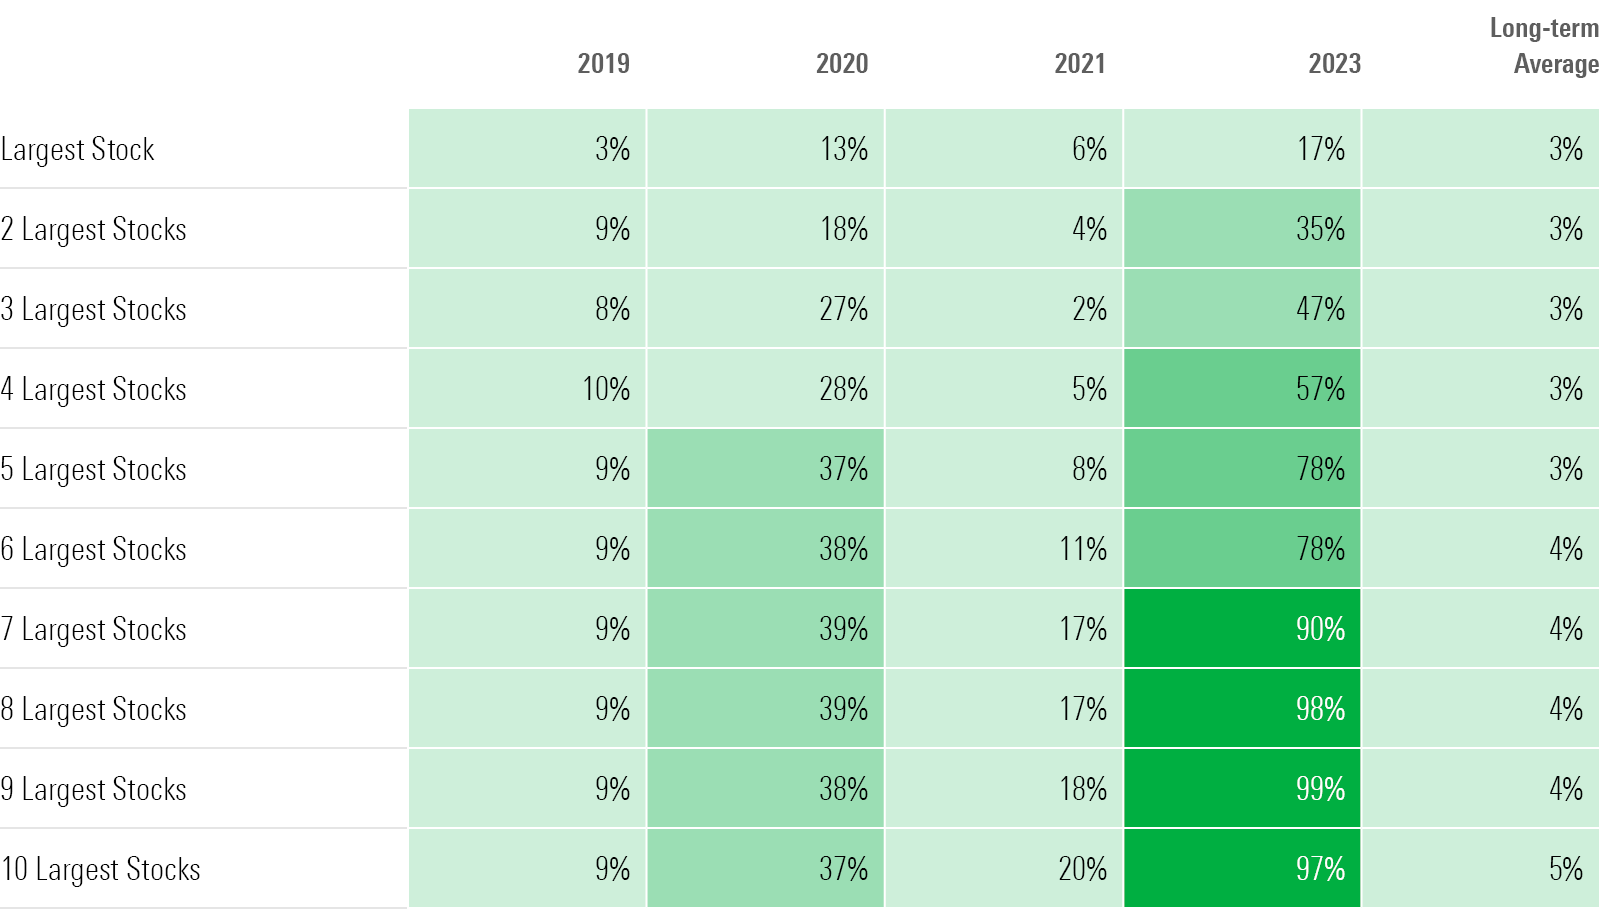
To dig deeper, we calculated the impact that the 10 largest stocks have had on the Morningstar US Large-Mid Index, which essentially tracks 90% of the stock market. We took the 10 largest stocks at the end of each year going back to 2009, and using Morningstar Direct’s equity attribution tool, we excluded their returns from the index’s performance and compared that number with each year’s total return.
In the following table, the concentration of returns can be seen across the readings for the largest stocks. For example, the three largest stocks accounted for less than 10% of returns in most years since 2009, with the key exception of 2020.
But this year through May, Apple—the largest stock in the U.S. market, with a market capitalization of $2.8 trillion—has been responsible for 17% of the market’s returns. The largest three stocks this year have together contributed 4.5% of the stock market’s rise out of the overall 9.6% rise (nearly 50%).
Cumulative Market Impact of the Largest U.S. Stocks
Apple, with the top weighting in the index at 7.1%, rose 36.8% for the year through May. With such a high weighting, that meant Apple alone contributed 17% of the Morningstar US Large-Mid Index’s 9.6% gain. Add in Microsoft and its $2.4 million market cap (which carries a weighting of 6.5% of the index and gained 37.5%), Alphabet and its $1.6 trillion market cap (whose two share classes together make up 3.7% of the index, and which each rose about 39%), and Amazon and its $1.2 trillion market cap (2.9% weight in the index and up 44% for the year through May), and over half of the market’s moves are accounted for.
When the fifth-largest stock, Nvidia—which surged on its strong first-quarter earnings report, up 159% for the year—is added into the equation, that covers 7.5% out of the entire market’s 9.6% gain through May (78%).
Meta—the seventh-largest stock in the U.S. market, with a total capitalization of $678 billion, which has risen 120% for the year through May—was by itself responsible for 12% of the entire market’s move for the same period, bringing the sum contribution up to 8.65%. On top of that, Tesla (with a $646 billion market cap) rose 65.6%, contributing a 1.15% gain (8% of the market’s entire move).
Visa V, with a market cap of $463 billion, gained 5.4% through May, adding a small additional move to the market of 0.08% (1% of the total gain). Meanwhile, Warren Buffett’s heavyweight holding company Berkshire Hathaway BRK.B, the sixth-largest stock in the U.S. market as of May, had a modest gain of 3.9% in 2023 through May. That gave it only a small impact on the broad market’s returns, adding 0.04%, or less than 1% of the market’s overall move
Not all of the 10 largest stocks have contributed positively to the market this year. Private health insurance giant UnitedHealth Group UNH, the 10th-largest stock with a market cap of $453 billion, has fallen 7.8%, acting as a 0.15% drag on the market.
U.S. Market Return Composition
The author or authors do not own shares in any securities mentioned in this article. Find out about Morningstar’s editorial policies.
:quality(80)/cloudfront-us-east-1.images.arcpublishing.com/morningstar/GJMQNPFPOFHUHHT3UABTAMBTZM.png)
:quality(80)/cloudfront-us-east-1.images.arcpublishing.com/morningstar/UYSRGR6ZLJFWXDECADZPSR7BJU.png)
:quality(80)/cloudfront-us-east-1.images.arcpublishing.com/morningstar/MLKHO4HEDJETLPBTREPIAMGQBE.png)